

product Details
Explore More
Alternatives

About Chart Echo
Chart Echo is a specialized market analysis tool designed to help traders and investors make more informed decisions by finding historical chart patterns that closely resemble the current setup they are watching. Instead of relying on subjective interpretation or guesswork, Chart Echo searches through approximately 450 million historical windows across stocks and cryptocurrencies to identify moments in the past where the market looked strikingly similar. Once these matches are found, the tool overlays the historical pattern in gold directly onto the user's current chart and provides detailed outcome statistics that show exactly what happened next. This includes data on how often similar setups rose, fell, or went nowhere, along with the average move and typical drawdown. Chart Echo is built for active traders, long-term investors, and crypto watchers who want a data-grounded perspective on market behavior. The tool is free to start with no account required, and it offers a guided, five-step flow that takes users from selecting a market to saving a workspace or sharing results. It is not a prediction system or financial advice; rather, it is a way to access the market's own memory in seconds, allowing users to study real precedent before making a decision. The product is available as a web application and also has a guided mobile experience for checking setups away from the desk.
Features
Historical Pattern Matching
Chart Echo searches through roughly 450 million historical windows across stocks and cryptocurrencies to find moments where the market looked most like the chart you are currently viewing. This massive database allows the tool to identify patterns that have rhymed before, including bases, breakouts, blow-off tops, and capitulation lows. Each match comes with a similarity score and an explanation of why it rhymes, giving users a clear understanding of the historical precedent.
Outcome Statistics and Overlay
Once a historical match is found, Chart Echo does not just show you the pattern; it shows you what happened next. The tool overlays the historical match in gold directly on your current chart, allowing for a visual comparison. It then provides aggregate outcome statistics that detail how often setups like this rose, fell, or went nowhere, along with the average move and typical drawdown. This data gives users an honest, data-grounded picture of the odds.
Guided Five-Step Workflow
Chart Echo offers a single, guided path through the app that takes users from start to finish without guesswork. The flow includes picking a market, setting the timeframe and pattern definition, viewing a ranked list of historical echoes, overlaying a match to read outcome statistics, and finally acting on the information by saving the workspace, setting a reminder, or sharing a Story GIF. This structured approach ensures users get a clear answer every time.
Cross-Asset and Multi-Timeframe Support
Chart Echo supports both stocks and cryptocurrencies, allowing users to match BTC, ETH, and other major assets against their own past structure and across different assets. The tool also supports various timeframes, including intraday options for Premium users. This flexibility enables users to apply the same pattern-matching methodology whether they are day trading, swing trading, or conducting long-term analysis.
Use Cases
Pre-Trade Setup Validation for Active Traders
Before taking a trade setup, active traders can use Chart Echo to see the closest historical analogs and how they resolved over the following weeks. By studying the odds, average move, and typical drawdown, traders can validate their thesis or reconsider their entry. This use case helps reduce emotional decision-making by replacing subjective feelings with concrete historical data, allowing traders to act with more confidence based on what has actually happened before in similar market conditions.
Sanity-Checking Breakouts for Long-Term Investors
Long-term investors can use Chart Echo to sanity-check a breakout or a sell-off against decades of precedent instead of relying on a single pundit's opinion. When a stock makes a significant move, investors can search for similar historical patterns to see how the market behaved after those events. This provides a broader context for decision-making, helping investors distinguish between a genuine trend change and a temporary anomaly, all framed by the market's own history.
Crypto Pattern Analysis for Digital Asset Watchers
Crypto markets are known for their repetitive and often extreme patterns, making Chart Echo particularly valuable for crypto watchers. Users can match Bitcoin, Ethereum, and other major cryptocurrencies against their own past structure and across different assets to spot where today's chart has happened before. This use case is especially helpful for identifying potential breakout or breakdown scenarios in a highly volatile asset class where historical precedent can offer crucial guidance.
Educational Study of Market Rhymes for New Traders
New traders can use Chart Echo as an educational tool to understand how markets move in repeating patterns. By searching for historical matches on any chart they are studying, they can see concrete examples of how similar setups played out in the past. This hands-on approach accelerates learning by providing immediate, visual feedback on pattern recognition and outcome probabilities, helping new traders develop a more data-driven mindset from the start.
Frequently Asked Questions
What exactly does Chart Echo do?
Chart Echo searches a database of roughly 450 million historical chart windows to find patterns that look like the chart you are currently viewing. It then overlays those historical matches on your chart in gold and shows you detailed statistics on how those patterns resolved, including the percentage of times they went up or down, the average move, and the typical drawdown. It is a research tool that provides data on historical precedent, not a prediction system.
Is Chart Echo free to use?
Yes, Chart Echo is free to start with no account required. You can immediately search for historical matches on any supported stock or cryptocurrency. Creating an account unlocks the ability to save workspaces for future reference. Premium subscriptions are available for users who want additional features such as Pro Mode, saved-setup reminders, intraday timeframes, alerts, and watermark-free exports.
Does Chart Echo provide financial advice or predictions?
No, Chart Echo does not provide financial advice or predictions. The tool explicitly states that it is not a prediction system. Instead, it organizes the market's own historical memory so that users can study precedent in seconds. The outcome statistics show what happened in the past under similar conditions, but past performance does not guarantee future results. Users should always do their own research and consider their own risk tolerance.
What markets and timeframes are supported?
Chart Echo supports both stocks and cryptocurrencies, including major assets like Bitcoin and Ethereum. The tool supports multiple timeframes for pattern definition, allowing users to set how many candles define the pattern they are searching for. Premium users gain access to intraday timeframes for more granular analysis. The database covers a vast range of historical data across these asset classes, providing a broad foundation for pattern matching.
Similar to Chart Echo

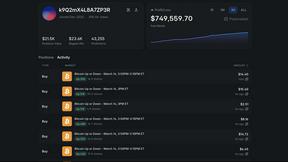
Polymarket Trading Bot For Crypto
Automate high-frequency arbitrage and directional trading on Polymarket's 5-15 minute crypto markets using a transparent, locally-run bot with proven.